
End of Key Stage 2 results 2023:
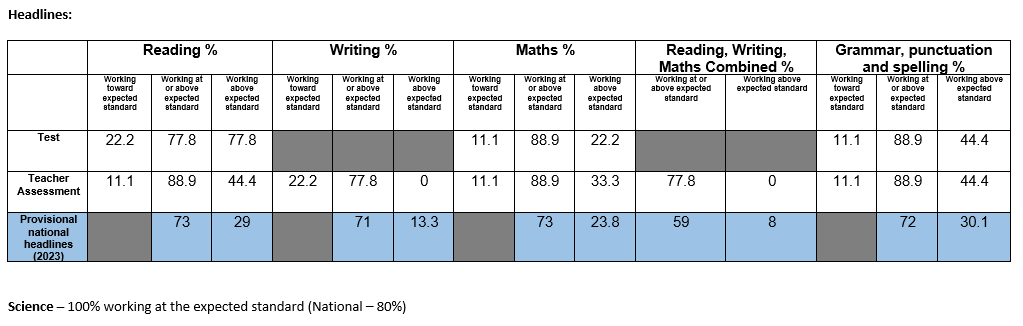
The government will not publish key stage 2 school level data for the 2021 and 2022 academic years. The last available public data is from the 2018 to 2019 academic year. It is important to note that the data from that year may no longer reflect current performance. Please see below
At the end of Key Stage 1 (Year 2) and KS2 (Year 6), the children complete statutory SAT (Standard Attainment Test) assessments.
What are SAT’s?
SATs (Standard Attainment Tests) take place at the end of year 2 and year 6 and are designed to test pupils’ knowledge and understanding of the Key Stage 1 and Key Stage 2 programme of study respectively. All year 2 and year 6 children across the country are tested in English and Maths and this gives the government a clear picture of what standards look like. It also helps parents compare their child’s progress with children of the same age nationally. This is the third year that a year 2 and year 6 cohort has been tested on the new curriculum that was introduced in September 2014. Consequently, the testing process has been changed to previous years to account for this. The Keys Stage 2 results are published and inform the Department for Education ‘performance tables’.
To access the Dfe school performance tables, please click on the following link and follow the instructions:
https://www.compare-school-performance.service.gov.uk/find-a-school-in-England
Please note that the above link now provides results for 2019.
Here are the headline results for Curbar Primary School (2019):
|
Y1 Phonics results 2019: |
|
|
100% of our pupils (4 pupils) achieved the required standard in the phonics screening check. (National score 2018 – 82%). No pupils repeated the check in Year 2. |
|
|
End of Key Stage 1 results 2019: |
|
|
Y2 Attainment |
|
| These results are based on teacher assessment. | |
|
Cohort of 7 children – each child represents approx. 14.3%
|
|
Reading |
Writing |
Maths |
|||
| Met Expected Standard at Curbar
(Exceeding the standard) |
86% (71%) |
Met Expected Standard at Curbar |
86% (43%) |
Met Expected Standard at Curbar |
86% (43%) |
|
National 2018 |
76% |
National |
68% |
National |
75% |
|
End of Key Stage 2 results 2019: |
|
Y6 Attainment |
|
Cohort of 13 children – each child represents 7.7% |
|
Reading National in brackets (2019 provisional) |
Writing National in brackets (2019 provisional) |
Maths National in brackets (2019 provisional) |
Reading, Writing, Maths Combined National in brackets (2019 provisional) |
Spelling, Punctuation and Grammar National in brackets (2019 provisional) |
||||||||||
|
Working Towards Expected Standard |
Working at or above Expected Standard |
Working at Greater Depth |
Working Towards Expected Standard
|
Working at or above Expected Standard |
Working at Greater Depth |
Working Towards Expected Standard
|
Working at or above Expected Standard |
Working at Greater Depth |
Working Towards Expected Standard |
Working at or above Expected Standard |
Working at Greater Depth |
Working Towards Expected Standard |
Working at or above Expected Standard |
Working at Greater Depth |
|
8% (27%)
|
92% (73%)
|
38% (27%)
|
15% N/A |
85% (78%)
|
23% (20%)
|
23% (21%)
|
77% (79%)
|
15% (27%)
|
31% (35%) |
69% (65%)
|
8% (11%)
|
8% (22%) |
92% (78%)
|
8% (36%)
|
|
Average Scaled Score in Reading – 107.3 (2019 Provisional National Data – 104)
Average Scaled Score in Writing – N/A Teacher Assessment only
Average Scaled Score in Maths – 103.1 (2019 Provisional National Data – 105)
Average Scaled Score in SPAG – 104.5 (2019 Provisional National Data – 106)
|
|
Y6 Progress (National progress figure is 0) |
|
Reading Progress: – 0.6
Writing: – 2.0
Maths: – 5.0 |